Yesterday I discussed the Bonnie++ tool, which can be used to benchmark filesystem performance. When you are tweaking a RAID and filesystem combination, you generally want to see whether your changes work in a positive manner across the board, and by how much. I created a utility called bonnie-to-chart to show the results of multiple Bonnie++ runs in either absolute or relative performance terms. It's primarily a Perl script that can be used together with the Open Flash Chart component.
Bonnie-to-chart can report results in absolute terms, showing multiple benchmarks on a single graph, allowing you to see the absolute KB/sec throughput of each benchmark run. It also provides a relative mode, where you run a single "baseline" benchmark on a system in a default or current state, modify the system, and rerun Bonnie++. You can then quickly compare the results of the two Bonnie++ runs, seeing the results of the subsequent runs not in terms of raw KB/sec but in terms of how much more or less KB/sec each run achieves relative to the baseline benchmark.
The main requirements of bonnie-to-chart are the Perl modules CGI and Text::CSV_XS. You will also need to download Open Flash Chart. The bonnie-to-chart distribution tarball includes bonnie.csv, index.php, and chart-data.cgi.
You must install the software by hand by expanding the bonnie-to-chart tarball and selecting the required parts out of an Open Flash Chart tarball. Here I install bonnie-to-chart under my WebRoot (/var/www/html) in the bonnie-to-chart subdirectory:
# cd /var/www/html
# mkdir bonnie-to-chart
# tar xzvf /T/bonnie-to-chart.001.tar.gz
# cd bonnie-to-chart
# mkdir tmp
# cd tmp
# unzip /T/open-flash-chart-1.9.7.zip
# mv open-flash-chart.swf ..
# mv php-ofc-library ..
# mv perl-2-ofc-library/
# mv perl-2-ofc-library/open_flash_chart.pm ../cgi-bin/
# cd ..
# rm -rf tmp
# cd /var/www/html/
# chown -R ben.apache bonnie-to-chart
# chmod +s bonnie-to-chart
You also need to tell Apache that the cgi-bin directory contains files that should be executed rather than downloaded from the Web server by adding a ScriptAlias to your httpd.conf file, as shown in bold below:
# vi /etc/httpd/conf/httpd.conf
...
ScriptAlias /cgi-bin/ "/var/www/cgi-bin/"
ScriptAlias /bonnie-to-chart/cgi-bin/ "/var/www/html/bonnie-to-chart/cgi-bin/"
...
Running some benchmarks
 Click to enlarge It is convenient to run Bonnie++ from a shell script that varies one or more parameters and benchmarks each configuration. The script below is an example that I used to benchmark the performance of RAID-5 and RAID-6 on six drives with various chunk sizes. A parity RAID like RAID 5 or 6 is divided into chunks as logical building blocks. As a concrete example, if you are using RAID-5 on six disks, with a chunk size of 64KB (the default for such RAIDs created with mdadm), then the first 64KB chunk is written to the first drive, the second 64KB to the second drive, the fifth to the fifth, and the parity to the sixth drive. These six chunks make up a single stripe on the drive. When writing the second stripe on the disk, the chunks move down a slot, so the first chunk is written to the second disk, the second chunk to the third disk, and so on, with the parity being written to the first disk for the second stripe. Sometimes for reporting the number of disks in a stripe, the number of disks that are used for parity are not counted, so the six-disk RAID-5 has a stripe size of five because conceptually one disk is used purely for parity.
The script shown below assumes that all the partitions listed in DISK_PARTITIONS can be completely destroyed and used for testing RAID performance. The two driving lists in the script are those in the RAIDLEVEL and CHUNK_SZ_KB for loops. For each RAID-5 and RAID-6 the performance of a selection of chunk sizes is tested. For each RAID and chunk size many different filesystems are created in different ways.
The alignment of data in the filesystem to chunk boundaries can have a profound impact on the performance of the filesystem. Some edge cases arise when dealing with journaling filesystems and how to best handle writing the journal data as the chunk size increases.
The Bonnie++ benchmarks are appended to bonnie.csv in your home directory. To make these available to the bonnie-to-chart Web application, copy them to /var/www/html/bonnie-to-chart/bonnie.csv.
#!/bin/bash

cd /dev/disk/by-id

DISK_PARTITIONS="/dev/disk/by-id/scsi-SAdaptec_dev*part1"
TOTAL_DRIVE_COUNT=$(echo $DISK_PARTITIONS | tr ' ' '\n' | wc -l);

for RAIDLEVEL in 5 6
 do
 PARITY_DRIVE_COUNT=$(( $RAIDLEVEL-4 ));
 NON_PARITY_DRIVE_COUNT=$(( $TOTAL_DRIVE_COUNT - $PARITY_DRIVE_COUNT ));
 echo "Tesing RAID:$RAIDLEVEL which has $NON_PARITY_DRIVE_COUNT parity drives..."

 for CHUNK_SZ_KB in 4 8 16 32 64 128 256 1024 4096
   do

   STRIDE_SZ_KB=$((CHUNK_SZ_KB/4));
   echo "Testing CHUNK_SZ_KB:$CHUNK_SZ_KB STRIDE:$STRIDE_SZ_KB"
   mdadm --create --run --verbose -e 1.2 --auto=md --verbose /dev/md-tmpraid \
 --level=$RAIDLEVEL --raid-devices=$TOTAL_DRIVE_COUNT  \
 --chunk=$CHUNK_SZ_KB \
 $DISK_PARTITIONS
   sleep 1;
   echo "Waiting for RAID to reshape..."
   mdadm --wait /dev/md-tmpraid
   sleep 1;

   fsdev="raid${RAIDLEVEL}_chunk${CHUNK_SZ_KB}_ext3";
   mkfs.ext3 -F -E stride=$STRIDE_SZ_KB /dev/md-tmpraid
   mkdir -p /mnt/tmpraid
   mount -o data=writeback,nobh /dev/md-tmpraid /mnt/tmpraid
   chown ben /mnt/tmpraid
   sync
   sleep 1
   echo "benchmarking $fsdev..."
   sudo -u ben /usr/sbin/bonnie++ -q -m $fsdev -n 256 -d /mnt/tmpraid >>~/bonnie.csv
   umount /mnt/tmpraid


   fsdev="raid${RAIDLEVEL}_chunk${CHUNK_SZ_KB}_xfs";
   mkfs.xfs -f -s size=4096  \
 -d sunit=$(($CHUNK_SZ_KB*2)),swidth=$(($CHUNK_SZ_KB*2*$NON_PARITY_DRIVE_COUNT)) \
 -i size=512 \
 -l lazy-count=1 \
 /dev/md-tmpraid
   mkdir -p /mnt/tmpraid
   mount -o nobarrier /dev/md-tmpraid /mnt/tmpraid
   chown ben /mnt/tmpraid
   sync
   sleep 1
   echo "benchmarking $fsdev..."
   sudo -u ben /usr/sbin/bonnie++ -q -m $fsdev -n 256 -d /mnt/tmpraid >>~/bonnie.csv
   umount /mnt/tmpraid


   fsdev="raid${RAIDLEVEL}_chunk${CHUNK_SZ_KB}_xfslogalign";
   mkfs.xfs -f -s size=4096 \
 -d sunit=$(($CHUNK_SZ_KB*2)),swidth=$(($CHUNK_SZ_KB*2*$NON_PARITY_DRIVE_COUNT)) \
 -i size=512 \
 -l lazy-count=1,sunit=$((CHUNK_SZ_KB*2)),size=128m \
 /dev/md-tmpraid
   mkdir -p /mnt/tmpraid
   mount -o nobarrier /dev/md-tmpraid /mnt/tmpraid
   chown ben /mnt/tmpraid
   sync
   sleep 1
   echo "benchmarking $fsdev..."
   sudo -u ben /usr/sbin/bonnie++ -q -m $fsdev -n 256 -d /mnt/tmpraid >>~/bonnie.csv
   umount /mnt/tmpraid

   mdadm --stop /dev/md-tmpraid
   sleep 1;
 done

done
The core script of bonnie-to-graph is cgi-bin/chart-data.cgi. At the top of chart-data.cgi are some definitions you can change for the colors used for the bars and the CSS used for the graph title. The read_bonnie_csv function handles parsing the Bonnie++ comma-separated file from the input file, which is /var/www/html/bonnie-to-chart/bonnie.csv by default as defined toward the top of chart-data.cgi. read_bonnie_csv also handles converting the benchmark results into numbers relative to the first benchmark result if the relative CGI parameter is present. Another CGI parameter that is accepted is metadata, which causes the script to create the graph of metadata operations rather than the default block IO benchmarks. The chart-data.cgi script ends by looping over all the Bonnie++ benchmark results loaded by read_bonnie_csv and creating a bar for each result that should be shown (either block IO or metadata) and setting appropriate minimum and maximum axis values.
Results
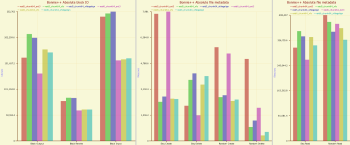
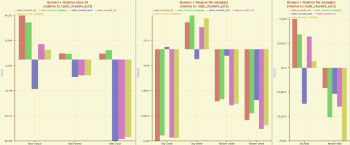
 Click to enlarge The results are presented as figures either reporting absolute figures or performance relative to the first result in bonnie.csv. In relative reporting mode, the first result itself is not reported because it will always be zero for each benchmark. Presenting results in a relative manner allows you to quickly see whether your filesystem modifications are giving you positive performance, and which from a group is the best choice. Relative mode is great if you are running benchmarks on the same hardware, just tweaking filesystem or RAID configuration, because you are less likely to care about the exact throughput and more about how your changes affect the benchmark.
The results of running a 64KB chunk size on RAID-5 and RAID-6 using ext3 and two XFS setups are shown below. It took about 1.5 hours to complete all of the Bonnie++ runs for the 64KB chunks size. You can see from the absolute graph that software RAID-6 gives a huge drop in rewrite and input performance but does not affect block output as severely. The baseline for the relative graph is ext3 running on RAID-5. You can easily see from the relative graph that XFS running on RAID-6 is actually faster for block output than ext3 running on RAID-5 on the benchmark hardware.
The relative graph is much more informative for displaying the Bonnie++ metadata operation benchmarks. The ext3 configurations handle sequential and random create operations much more efficiently than XFS. Of particular interest is the difference on the relative graph between the xfs and xfslogalign datasets. By stripe-aligning the XFS journal log for the xfslogalign filesystem, the relative performance of logalign is better than the defaults that mkfs.xfs chose for this filesystem. What might not have been quite as expected is that this change in the journal alignment also drops block output performance while increasing block input performance.
The bonnie-to-chart project is still in its infancy. I hope to support more graphing packages in the future and include a selection of scripts that can execute Bonnie++ for you. At the moment the script to run Bonnie++ presented about is very rough and unforgiving.


